This is a continuation of my previous post, that you can read here.
Executive Summary:
ICU data shows that pregnant or recently postpartum mothers accounted for less than 5-in-1000 ICU patients, not 1-in-5.
ICU data shows that the number of mothers per day being transferred to ICUs almost doubled only after the Covid-19 vaccine was approved for use and began to be administered to pregnant and recently postpartum mothers.
SICSAG data uses ‘number of days supported’ not ‘number of mothers’ and can be easily misunderstood. One mother’s prolonged stay in the ICU can misleadingly inflate the ‘number of days supported’ metric.
Stillbirths actually dropped during 2020, the primary Covid-19 and lockdown period, and only increased in 2021 after, and at a similar rate to, the number of pregnant mothers who recieved the Covid-19 vaccines.
Preterm birth rates dropped at the start of the Covid-19 period in the UK, and only increased back to pre-covid levels nine months after the Covid-19 vaccines were approved for administration to pregnant women.
Emergency caesarean sections (EMCS) mostly stayed consistent with pre-covid levels during 2020. However, since the Covid-19 vacine rollout to pregnant women the incidence of EMCS has increased by as much as an additional 31%.
In August 2021, only three months after the NHS started offering the jabs to pregnant women, Birmingham Women’s and Children’s Hospital (and several others) added this to their website:
It is interesting to note is that no effort was made on any of these NHS websites to actually quantify what “higher risk” actually meant. If, for example, during one month 37 women in the NHS were sent to ICU who did not have covid, and 38 women were sent who did, that would represent a “higher risk” but, let’s be honest, at 0.026% it is entirely negligible. What is more important are: (a) why they were sent to ICU (i.e. was it due to Covid or some other pregnancy or non-pregnancy related issue); and (b) was there any difference in outcome (i.e. mortality, permanent disability, infant mortality or something else).
Look at these quotes from this NHS web page:
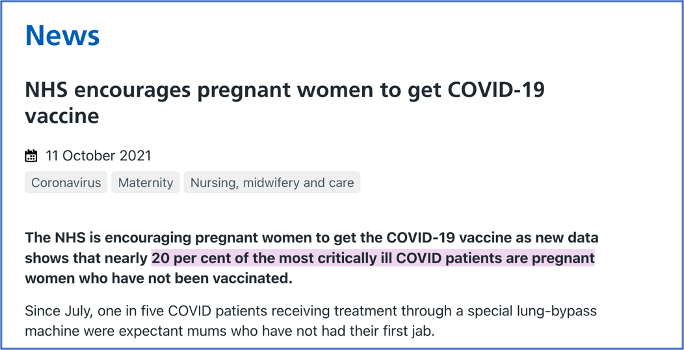
As we saw in Part 1, it wasn’t just the mainstream media trying to scare us into believing that ICUs were filling up with pregnant and postpartum women. In October 2021 and while being late to the party (the MSM and social media ‘medical influencers’ had been making these claims since March 2020!), NHS management and our then Health Secretary, the incredible1 Sajid Javid, seemed to be bringing up the rear guard on seeking to promote fear of Covid-19 in pregnant mothers to ‘nudge’ them to accept the jabs.
ICU Data:
In early 2021 the NHS temporarily stopped publishing ICU bed data. In early-2022 we attempted to answer the question of maternity cases in the ICU, but were hampered by the fact that the last ICU bed report we were able to access at that time was dated 4/4/2021, and the last CQC maternity services survey data had been released in 20192. Yet, at all times during the period charitable organisation Intensive Care National Audit and Research Centre (ICNARC) were still publishing regular reports with figures about Covid-19 ICU bed occupancy. So, even as we were being told that the NHS did not routinely publish data on intensive care bed availability, ICNARC were somehow still releasing this data that wasn’t being published.
Also, note that the NHS Adult Critical Care statistics have not been published since March 2015.
A key variable that made ICNARC’s data interesting for those analysing ICU data was that their May to September 2021 data claimed almost 2.5 current or recently pregnant women per day were being sent to ICU. Statistically, this suggests 2-3 women were placed in ICU during the period, for each and every obstetric facility registered in the UK.
Now, I don’t mean to imply that exactly 2.44 women were sent to ICU every day...
It is a given that some may have already been in ICU at the start of the period and were thus also counted in the previous period, and some would have remained after the period and thus gone on to also be counted in the next period. As such, the daily number of women going to ICU would have been entirely variable. But on average, based on ICNARC’s numbers, somewhere between 2 and 3 women per day. It also means, on the basis of the total, that during the period there were 2-3 women with covid in ICU for every obstetric unit in England, and that ignores that this is likely a gross exaggeration because many of England’s obstetric units are small and routinely must refer anything but the most uncomplicated of pregnancies upstream:
Midwifery units are those which are midwife led and as such, provide care only to the lowest risk women – no epidurals, no continuous monitoring of the baby, and no surgical or instrumental deliveries. These units may (AMU)3 or may not (FMU) be located with or near a larger hospital facility.
Obstetric units are those in hospitals that also provide care for higher risk pregnancies. Obstetric units will have different risk scoring criteria for the types of patients and pregnancies they can cater for. Smaller obstetric units may have a special care baby unit (SCBU) but often do not cater for births of an extreme preterm nature which they must refer to larger hospitals that have higher rated neonatal intensive care units (NICU).4
The five largest obstetric units in the UK can book as many as 8000 or more women annually, and deliver between 5000 and 6500 live babies.
Something else to note is that if we look at the table from their report they also give us the period prior to commencement of the mass Covid-19 vaccination of pregnant women, September 2020 to April 2021.
There are two things to note.
ICNARC want you to pay attention to the Deaths per 100 Days and the Total number of pregnant and recently pregnant women metrics (in red), because they look bigger and scarier in the second period.
They don’t want you to realise that (in blue): (a) the second period is almost 100 days (nearly 3 months) shorter than the first; and (b) that the average number of women per day being transferred to ICU almost doubled after the Covid-19 vaccines were made routinely available to pregnant women following the JCVI press release on the 30th of March, 2021.
What does this mean?
It means that fewer pregnant and recently postpartum women were being sent to ICU in 2020 and early 2021 during the main Covid-19 period. It also means that more pregnant and recently postpartum women were being sent to ICU after the Covid-19 vaccine rollout to pregnant women. The daily rate of ICU transfer almost doubled (from 1.32 to 2.44) after the vaccines.
At the time we were speaking with midwives at two of the five largest obstetric hospitals in England, Queens (BHRUT) and Liverpool Women’s (LWH) - where 5000 or more babies are delivered annually (a range of 16-25 per day). In both cases these hospitals are the catchment for higher risk-scored pregnancies from as many as 8 surrounding obstetric units. During the ICNARC reporting period Queens had delivered around 2930 pregnancies, and had only three pregnant or recently postpartum women transferred to ICU (3-in-2930 pregnancies or approximately 0.102). One less-serious woman had remained on premises, while two others who were on ECMO had been transported to another London facility.
Liverpool Women’s Hospital’s most recent report shows that for the whole 2021-2022 period they, a hospital that delivered more than 5000 babies, had just 199 Covid-19 PCR positive patients of which pregnant mothers were a sub-group. They had no Covid-19 positive staff, no inpatient outbreaks, and no women were transferred for ICU or ECMO care as a result of Covid-19 infection. The report even describes that only 1 nosocomial (hospital acquired) infection of Covid-19 was observed during the entire reporting period.
So much for Covid-19 being a highly virulent airborne killer disease?
Jim Jones’ Kool-Aid almost looks more effective.
In September 2022 the Scottish Intensive Care Society Audit Group (SICSAG) released their annual audit of critical care in Scotland. This audit reports primarily on incidents in both intensive and high dependency care units during 2021 and through comparison to the same elements in 2019 and 2020, identifies trends in usage, capacity and patient outcomes.
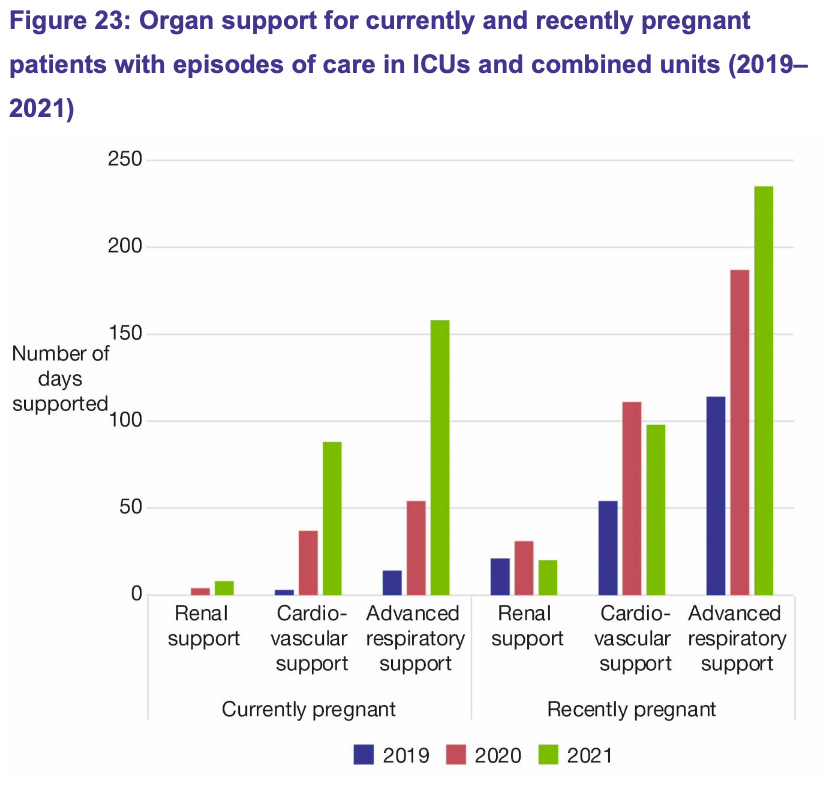
One image from the SICSAG report more than any other has been alarming people.
Figure 23:
Leaving aside that there are significant rises being suggested between 2019 (pre-covid) and 2020 (Covid-19). There is a sinificant rise in 2021, after the Covid-19 vaccines were deployed that I suspect will be quite devisive. Those who believe Covid-19 is responsible for the 2020 rise will be quick to say it is simply a year on year increase of the affect of Covid-19. Similarly, there will be those who will be quick to blame this rise on the vaccines. In either case we have insufficient evidence in just the diagram alone to call it either way. However, I believe there is a big issue with this diagram that most people will overlook.
Before we consider that issue, let’s look at some other relevant points from the SICSAG report:
Figure 15 tells us that more babies were looked after with their mother in 2020 (81% during Covid-19) than 2019 (78% pre-covid). This trend continued in 2021 with a rise to just over 90%. This is significant because if the mother requires an intensive care admission, it is normal for them to be cared for separately. This means that more mothers stayed with their babies on obstetric wards, and therefore fewer mothers overall were separated from their babies because of, amongst other things, admission to the ICU.
Figure 21 shows that while there was a 25% increase from 2019 to 2020 in pregnant mothers being admitted to ICU, the rate of recently postpartum mothers dropped by 11.5% in the same period. Overall this means that during the entire 2020 Covid-19 only period there was actually 7 fewer obstetric patients admitted to ICU. Covid-19 alone only impacted slightly on pregnant women’s ICU admissions. This observation is also consistent with the ICU data of other countries.
Figure 21 also shows that in 2021 ICU admissions for pregnant mothers increased by 185% over pre-covid levels, and 108% over 2020 Covid-19 levels. Admission rates for recently postpartum mothers were only slightly elevated at 1.9% higher than pre-covid levels, but were 15% elevated above 2020’s Covid-19 only levels. Overall this means that only the rate of pregnant women was significantly elevated in 2021. Given we have already seen that Covid-19 alone did not appear to have a significant negative impact on pregnant and recently postpartum ICU admissions, consideration must be given to the Covid-19 vaccines as a possible cause.
Notice that the Y axis on Figure 23 is labelled Number of Days Supported. To put it simply, this has no relationship to the number of people who were transferred or admitted to ICU. What we are not told is whether the numbers presented on this axis represent the average numbers of days that each patient is supported in ICU, or the average number of patient days that pregnant and recently postpartum women were in the ICU during each period. If SICSAG is in keeping with other similar reports then it is the latter. This means that during 2021 pregnant and recently postpartum women were cumulatively in the ICU for a total of approximately 235 patient days. While that number is clearly higher than previous years, it is potentially misleading.
Postnatal women end up in ICU for a whole range of reasons, mostly centring on excess blood loss. Often, if something goes terribly awry during a caesarean the woman will be transferred to ICU still unconscious and on a respirator to be stabalised. This very likely accounts for most of the women (not days, as the graph shows) who end up in ICU. And further, if a woman is in seriously poor health and needs intensive care while the baby is on board, if the baby is 32+ weeks gestation and the case can be made that she and the baby have a better chance of survival if parted, the obstetrician will step in, wave their magic wand, one becomes two and the woman goes to ICU on a respirator sans baby.
However, one significant difference for the few women who did end up on ECMO due to covid is this: they had exceedingly LONG stays. While pregnant women with severe flu have always ended up staying in ICU longer, the hospital data I have seen shows that for the VERY SMALL number of women who ended up in ICU on ECMO during 2021 – their stays ranged from 34 to 130 days. Given that a pregnant or recently postpartum woman usually has a stay of between 0.8 and 3 days, it only requires as few as ONE additional woman who stayed for 130 days (for example: in England there was one pregnant or recently postpartum woman referred to a specialist ICU on ECMO from Queens Hospital -BHRUT who was in ICU for over 130 days), TWO who stayed for 70 days, or FOUR who stayed for 36 days to create that massive spike you can see in “days supported”.
Therefore, I believe not only is the graph potentially misleading because it can easily be misunderstood - I believe the narrative in the paragraph above the graph is as well.
The actual numbers of pregnant and recently postpartum women that were admitted to ICU can be found on page 42 of the report. 48 pregnant women were admitted to ICU, and 27 recently postpartum women, for a total of 75 pregnant or recently postpartum women. The SICSAG report also tells us that 16,036 patients overall were admitted to the ICU during the same period. Therefore, pregnant and recently postpartum women only account for 0.47% of the ICU admissions for the year - or 4.7 in 1000 patients.
For reference, the exaggerated claims of 1-in-6 patients in ICU being pregnant or recently postpartum would equate to 167 in 1000 patients. There’s a whole world of difference between 4.7 and 167 - that shows the government, mainstream media and social media ‘medical influencers’ claims of 1-in-6 were always entirely falacious.
Stillbirth Rates:
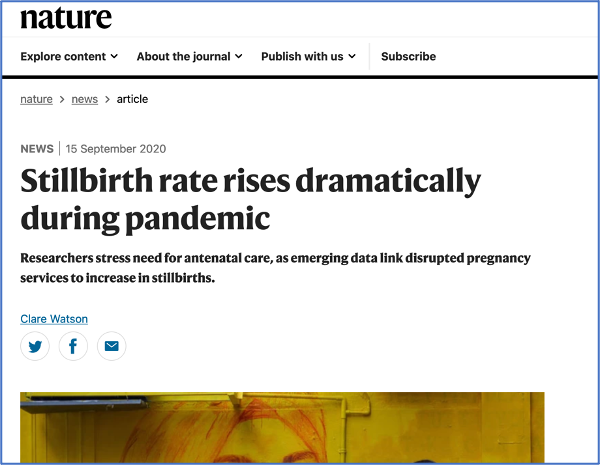
There are a number of other poor outcome indicator examples that relate to the pregnant women, Covid-19 and ICU issue. In late 2020 influential journals like Nature, and the mainstream media, all told us that stillbirth rates were rising in 2020 due to Covid-19.
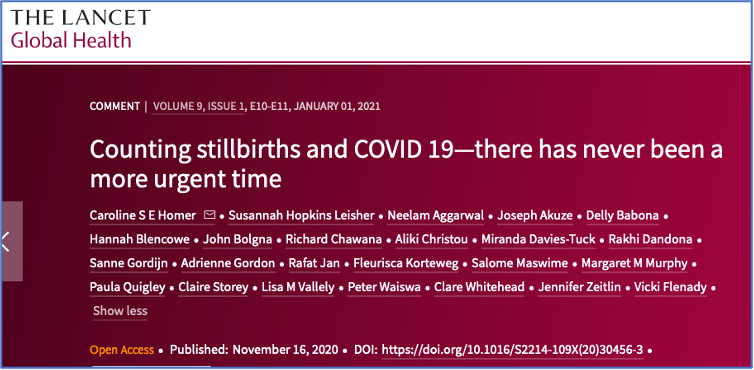
The much maligned as covid-19 corrupt Lancet on November 16, 2020 published an article online that on first blush seeks to heighten fears by suggested that Covid-19 was affecting the lives of millions of women and children and further increasing the risk of stillbirth.
Much of the article relied on a Joint UNICEF/WHO estimates for stillbirth, that had been published in October 2020. The UNICEF/WHO report looked at country-based statistics up until 2019 that clearly showed stillbirths had been steadily dropping for 19 years (see below), and presented four scenarios for the future in stillbirth rate decreasing order. That: (i) 2019 stillbirth rates remain constant; (ii) current decreasing trends are maintained; (iii) Every Newborn Action Plan (ENAP) 2030 targets are met; and (iv) High Income country average rate matched by all other countries. None of these scenarios, in a report authored during the Covid-19 pandemic and released in October 2020, considered Covid-19 as having an appreciable effect on stillbirth rates.
The authors of the Lancet article appear to have adopted a fifth position not even contemplated by the report’s authors. One invented in their own minds, and potentially motivated by the need to get their names in what had previously been a highly prestigious journal. They sought to use the stillbirth estimates published in the UNICEF/WHO article to support an entire article dedicated to the notion that mothers faced a greater burden of stillbirth due to Covid-19 borne, as the saying goes, entirely out of whole cloth. Just like the claims made in the infamous John Snow memo, this most significant and headlining of assertions was supported not by citation or statistical evidence, but by absolutely nothing at all. No supporting evidence was offered to underpin the claim, making it pure conjecture.
In 2021, even the CDC were telling us that pregnant women diagnosed with Covid-19 were at an adjusted relative risk of 1.90 (1.69-2.15) for a stillbirth.
The question we should ask two years on is, does the data support these claims? Did Covid-19 cause elevated stillbirth and premature birth rates? Did Covid-19 mean women were at a significantly higher risk of these poor outcomes?
Let’s start with stillbirths.
Using data for stillbirths in England and Wales (ONS Births in England and Wales for 2019, 2020, 2021) we produced the following graph to show monthly stillbirths (scale on the left represents total number of stillbirths). The peak on the left is mid-2019, the year before Covid-19. The even larger peak to the right is mid-2021 after the Covid-19 vaccines had started to roll out. Finally, The 2020 Covid-19 period is the trough in the middle. That is to say, the area that clearly shows a trend of reduction in, and ultimately fewer, stillbirths.
I have highlighted in yellow the period between March 2020, when Covid-19 started in the UK, and September, when the Nature and Lancet articles claim stillbirths were rising dramatically and women were most at risk. Generally, what we see in the data is that during this period, and across the whole of 2020, stillbirths were actually trending downward. The small peak in July is not out of place given that we also see peaks in July in both 2019 and 2021. However, it is far less prominent and lower than either of those years.
It is notable that the trend back upwards and ultimately onto a higher mean level of stillbirths commences in April 2021, right around the time that, as we saw before, Covid-19 vaccines began to be offered to all pregnant women and they were being pressured in the media to take them. Spikes in neonatal deaths also occured in Scotland in the September 2021 to March 2022 period, and were sufficiently high to lead the Scottish Parliament and Public Health Scotland to initiate an investigation in September 2022. The report from that investigation was careful to rule out Covid-19 vaccine involvement, however it transpired that vaccine status of the mothers was not ruled out based on an investigation or analysis, but rather because Public Health Scotland decided that it might result either in mothers suffering regret at getting Covid-19 vaccinated, or lead to information that would cause other unvaccinated mothers not to take the shots.
Surely this is the entire purpose of initiating an investigation into the cause of a negative event in the first place? To look at all new or possible factors and rule them out based on evidence… not dismiss them out of hand. If the Covid-19 vaccines are involved, as other investigations might suggest, then, and as with the thalidomide investigation decades earlier, this is something that not only bereaved mothers should know, but also something future mothers should be able to consider. That some might feel regret is inevitable - they are all likely feeling that it was something they did to their baby in utero anyway. What PHS is doing is leaving them without closure, which only serves to makes the hurt last longer. PHS are also creating the potential for more neonatal deaths and more grieving mothers by not actually investigating all possibilities and either ruling them out legitemately, or identifying them as the cause.
It is also notable that, as shown in green (scale on the right represents percentage of women delivering), the sharp rise in stillbirths that exceeds pre-Covid-19 levels, coincides with the levels of Covid-19 vaccination in pregnant women (statistics taken from the Covid-19 vaccine surveillance report Week 2 2023)
Preterm Birth Rates:
In order to look at preterm birth rates I need to introduce you to the following complex graph:
Preterm (premature) births in the UK are the red line in the lower quadrant of the image. It is notable that in spite of the NHS claim in the first image at the start of this post, preterm births actually dropped from 8% of total births to 7% (a 12.5% reduction) from May 2020. Coincidentally, it remained lower until December 2021, the ninth month after the Covid-19 vaccines began to be promoted to pregnant women and the point where the number of vaccinated pregnancies overtook unvaccinated. Maybe that tells us something? If nothing else at least it tells us that the NHS, mainstream media and social media ‘medical influencer’ claims were entirely factitious.
Covid-19 did not in and of itself result in an elevated risk for or overall increase in preterm birth.
It was exceptionally rare to find researchers actually acknowledging that stillbirth and premature birth rates were unaffected by Covid-19. One Canadian study looked at 2.4million births and found stillbirth and premature birth rates were both consistent when compared to the numbers from as much as the previous 17.5 years.
On analysis, their findings are similar to those I report here. Stillbirth and premature birth rates either remained consistent or slightly dropped during the Covid-19 emergency period from March 2020 up until the Covid-19 vaccines began to be administered to pregnant women. At that point, they rose above pre-covid levels.
Emergency Caesarean (EMCS) Rates:
The large graph shows emergency caesarean sections (EMCS) in purple. EMCS had been fairly stable for several years around 16% of all live births. They started to rise in March and April 2021, right after the Covid-19 vaccine rollout to pregnant women began. Over the last five months of data from April to August 2022, they rose to 21% of all live births - a level we have not seen since pre-2010. A separate review of patient record data conducted by another research team suggests that the majority of the additional EMCS are in women with blood pressure, clotting and bleeding issues that have resulted in pre-eclampsia, eclampsia, APH and high PPH. Anecdotal statements from midwives who were asked to review this article agree.
Issues with MBRRACE:
In looking at different maternity datasets we came to discuss MBRRACE with our midwifery colleagues. MBRRACE are a funded project run out of Oxford University that collects data directly from maternity units patient data across the entire UK. We identified a number of issues that make the publicly accessible (free) data from MBRRACE of poor, or at least confusing, quality and which could see it potentially misleading those who might use it to support assertions with respect to health service effectiveness, patient outcomes or even, given the heightened interest, the presence or absence of effects on maternity from the Covid-19 vaccines.
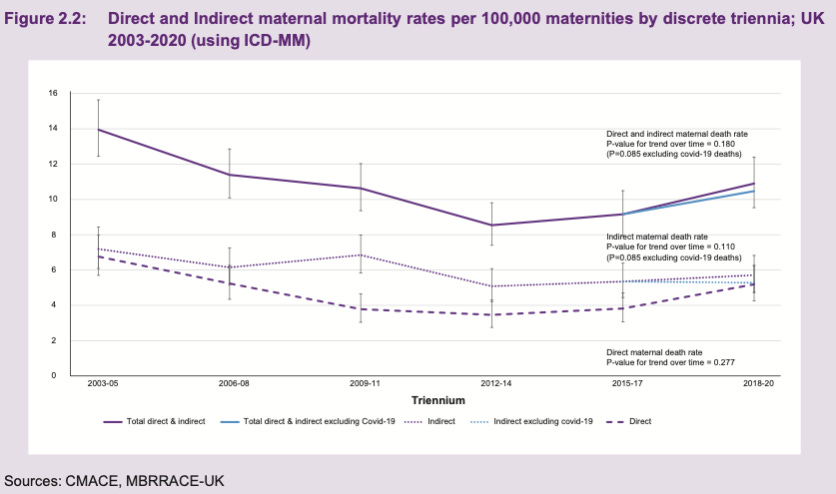
Provision of data in three year overlapping intervals makes the data useless as any change in one year gets absorbed and spread across the entire period such that all you end up with is averages. By intention, there is no way to make comparisons across each year and identify localised trends - such as the impact of reduced access to healthcare serives (including maternity) during the 2020 lockdowns. Like other data projects at Oxford University (for example, the OpenSafely and OpenPrescribing), the data used to create MBRRACE is the raw health records of almost every health service user in the UK. The UK taxpayer through funding grants and government contracts is paying for the collection and use of this data to create these datasets and reports, yet Oxford do everything they can to obfuscate and protect their fiefdom, charge fees to all including the general public for access to actual useable annual reports built using it (the free reports are the triennial ones which are next to useless for any credible purpose), and frustrate other health data researchers who might require access to it.
For example: when you look at the annual graph it is clear that there is an elevation in maternal mortalities per 100,000 pregnant women from 7 (2018) to 11 (2019). Even more confusing, they suggest in this graph that there is an impact from Covid-19 in 2019 of 0.25 deaths per 100,000, even before the UK had recorded its first Covid-19 case!
This comedic error gets absorbed into the 2018-2020 triennia and has resulted in mainstream media and social media ‘medical influencers’ claiming that Covid-19, in 2020, was causing deaths. We can see the same alleged impact from Covid-19 (0.25 deaths per 100,000 pregnant women) in the graph below which, if taken on face value from the graph above, occurred in 2019 before Covid-19 had come to UK shores. Presumably the resulting inference is that Covid-19 had no or almost no impact on maternal mortality at all in the three year period with 2020 at the middle?
Even the Covid-19 maternity, stillbirth and neonatal death for 2020 that was a ‘rapid release’ and one of the few that provides some annual level data uses quarters rather than monthly. If one month in a quarter is sufficiently higher than average while the other two months are lower, the appearance can be that for the entire quarter, rates of the observed event are elevated. On reviewing their stillbirth data this makes the data appear to indicate that stillbirths are equally elevated, for example, in October, November and December of 2019 (when we can see from the NHS Maternity Services Monthly Statistics that it is only October that is elevated). Similarly it makes the small peak in July 2020 significantly lift June and August 2020 well above their actual values.
In Conclusion:
We started this two-part post by looking at the incredible claims that pregnant women were at dramatically increased risk from Covid-19, and as a result were overrepresented in ICU - accounting for 1 in 6 (167 in 1000) ICU patients during 2020-2021. These claims were used to influence (‘nudge’) pregnant women to seek Covid-19 vaccination.
What we have seen is that rather than being 167 in 1000 ICU patients, the government’s own retrospective data shows that they were only 4.7 in 1000, and demonstrates the lie in government, mainstream media and social media ‘medical influencer’ claims.
Further, we have seen that other examples of poor pregnancy outcomes including stillbirth and preterm birth rates reduced during the period when Covid-19 alone was present. The rates of both rose only after the Covid-19 vaccine rollout to pregnant women, with stillbirth rates rising in lockstep with the vaccination rate of pregnant women, to a level that is now higher than they were in the year before Covid-19.
It is a testament to dedicated and hard-working frontline maternity staff that 2020 with the onset and two peaks of Covid-19 and multiple lockdowns resulted in a safe pregnancy journey for so many women.
Further, we have seen that the rate of emergency caesarean sections (EMCS) has dramatically risen by as much as 31% since March 2021 when the Covid-19 vaccine rollout to pregnant women began.
A final observation is that the large graph also shows a general decline in pregnancy bookings and a plateauing of births through 2022. This could simply be a short term artefact. Only time will tell whether these short-term trends continue or are resolved.
In any event the government, mainstream media and social media ‘medical influencer’ claims that pregnant women needed the Covid-19 vaccines to prevent ICU admissions, stillbirths and preterm births were clearly wrong.
Their fearmongering potentially led many women to do something that may be causal in the harms they were told it would prevent.
Erratum:
(i) Added PDF of the ICNARC report to ICU Data section
(ii) Corrected link to SICSAG report for 06/09/2022
(iii) Added the Public Health Scotland Neonatal death investigation - thank’s Clare!
(iv) Executive Summary added - thank’s Clare!
Here, I rely on the legal definition, meaning that he lacked credibility.
Note that both have since recommenced publishing these datasets.
AMU = Alongside Midwifery Unit. FMU = Freestanding Midwifery Unit. Both are run and staffed primarily by midwives but while AMU are usually alongside or attached to a hospital campus, freestanding midwifery units are separate from hospital facilities and do not have immediate obstetric, neonatal or anaesthetic care available.
For example: Liverpool Women’s Hospital routinely transfer neonates needing surgical or other high dependency specialist paediatric care to Alder Hey Children’s Hospital. They also routinely transfer women needing specialist surgical or ICU care for reasons that are outside the scope of obstetrics and gynaecology to Liverpool Royal Hospital.








Never before has there ever been encouragement to take or do anything questionable while you are pregnant, not ever!
this is a heinous crime! 
What a thorough analysis of complex information! With damning conclusions.
Thank you.